
Charting the Chesapeake 1590 - 1990
- Introduction
- Maps for Mariners
- Charts for Marylanders
- Chartmaking I: Copperplates to Computers
- Chartmaking II: Surveying the Seen and Unseen
- The Language of Charts
- Cartographers of the Chesapeake

The Language of Charts
A chart must display a wide variety of information about the body of water it describes. In order to efficiently indicate all relevant facts in one
Before symbols were standardized by the U.S. Coast Survey and subsequent government agencies, chartmakers freely invented their own. Here are some examples.
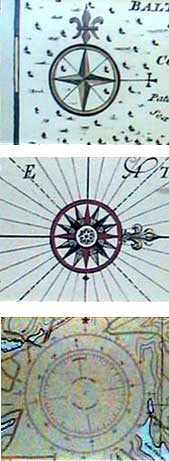
Rose of the Winds
The compass rose is perhaps the most important symbol on any chart. It provides the mariner a reference for determinng his position by indicating the thirty-two points of the compass.
The compass rose symbol reflects the directions of the wind. Early chartmakers devised the basic rose by indicating the direction of the four known winds -- north, south, east, and west.
The four winds became twelve as mariners recognized the variety of directions from which the wind actually blew. By the sixteenth century the rose indicated thirty-two winds, with eight primary winds subdivided into half-winds and again into quarter-winds.
The modern compass rose is a combination of the ancient rose of the winds and a reference indicating magnetic variation, or the angle between magnetic and true north.
Note the compass rose symbols on each chart in this exhibition.Compare the artistry of the early roses with the technical roses of modern charts.
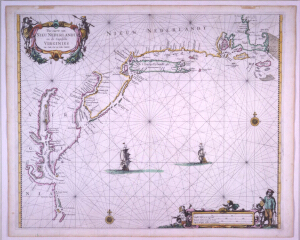
Pas Caerte Van Nieu Nederlandt en de Engelsche Virginies Van Cabo Cod tot Cabo Canrick
Pieter Goos
Amsterdam, 1666
Huntingfield Corporation Collection, MSA SC 1399-1-474
Dutch sea charts were about the only published charts available in the late seventeenth century. This one, like most others, has no soundings; it shows only sketchy shoals and is not based on original surveying. Its elaborate system of rhumb lines could give a navigator some idea of where he would strike land if a given course were taken. The only other symbol to assist the mariner is the compass rose, shown at that time without magnetic variation or change. A ship relying on this chart for transoceanic passage would have been lucky to survive.
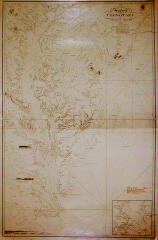
A Survey of the Chesapeake
Anthony De Mayne
London, 1820
Reproduction from the Library of Congress
Huntingfield Corporation Map Collection, MSA SC1399-1-184
This 1820 British Admiralty chart was based on surveys made in 1814. It contains a great deal of coded information for the navigator. Arrows indicate the direction of current flow; anchors indicate anchorages; and shoreline profiles assist with coast piloting. This chart also gave the most complete navigational light data of that time and indicated bottom conditions and prominent landmarks.
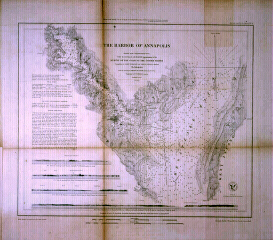
The Harbor of Annapolis
U.S. Coast Survey
Washington, DC, 1846
Huntingfield Corporation Map Collection, MSA SC 1399-618
This was the first U.S. Coast Survey chart of any part of the Chesapeake Bay. It features a number of symbols which were incorporated into later charts. Stippling indicates depth changes and single lines mark channels. Arrows indicate the direction and strength of ebb and flow tides. The chart also includes detailed topography, shoreline profiles, tidal notes, magnetic variation, and sailing directions.
|
This web site is presented for reference purposes under the doctrine of fair use. When this material is used, in whole or in part, proper citation and credit must be attributed to the Maryland State Archives. PLEASE NOTE: The site may contain material from other sources which may be under copyright. Rights assessment, and full originating source citation, is the responsibility of the user. |
© Copyright March 24, 2026 Maryland State Archives