
Charting the Chesapeake 1590 - 1990
- Introduction
- Maps for Mariners
- Charts for Marylanders
- Chartmaking I: Copperplates to Computers
- Chartmaking II: Surveying the Seen and Unseen
- The Language of Charts
- Cartographers of the Chesapeake

Chartmaking II: Surveying the Seen and Unseen
Aerial Photography and Charting
The greatest advance in topographic technology was the development of photogrammetry. This method of surveying uses photographs to provide the data upon which a map or chart is based.
In 1928 the multiple lens camera was invented permitting large area land surveying. There have been many improvements in the instruments and methods used for mapping. In 1937 a nine-lens camera was designed by Lt. Commander O.S. Reading of the U.S. Coast and Geodetic Survey and shortly thereafter photogrammetric mapping along the coasts of the United States began.
Aerial photography increased the accuracy of charts and made possible much faster revisions of data where important changes -- both natural and man-made -- had occurred. After World War II, the U.S. Coast and Geodetic Survey making extensive use of color photogrammetry. A color photograph provides more detailed information that can be interpreted as charts are produced. Photogrammetry is used in nautical charting to position landmarks and navigational aids, controls for inshore hydrographic surveys, to map the coastline and along shore features, and to maintain information on charts by monitoring the coastline for changes.
As electronic methods of navigation came into use, many of these topographic features on nautical charts of the bay were dropped in favor of greater clarity of the water areas. With present navigating aids, detailed topography is no longer of such major significance to a vessel's captain.
Surveying the Seen
Topographic surverying describes features seen on the land. In the early days of the U.S. Coast Survey, this type of surveying was an important part of the bureau's work. Detailed topography along the shorelines was included on nautical charts then because coastal piloting was the principal method of navigating in the bay.
During the second half of the nineteenth century, most of the U.S. Coast Survey charts contained complete and detailed topography for one-half to four miles inland, depicting buildings, woods, roads, cropland, docks, towers, and the like. The work required a large crew of men who observed, measured, and traversed the land. Since shoreline erosion was occurring at rates as high as eight to nine feet a year, results of these painstaking efforts were quickly out of date. The high labor cost and outdated information led the agency to discontinue such topographic surveys
The U.S. Coast Survey
The need for accurate charting of American coastal waters was evident well before the Revolutionary War. Existing charts were often inaccurate and unreliable because they were based on ad hoc surveys conducted by naval or merchantmen of areas they happened to visit.
In 1807 Congress authorized the government's first chartmaking agency, the Survey of the Coast. The agency's work was delayed by many things including the War of 1812, transfer to and from the military's control, and a simple lack of funding. Survey operations in the Chesapeake began in the 1840s, after the agency had been renamed the U.S. Coast Survey. Under the guidance of its first superintendent, Rudolph Hassler, charts produced by the U.S. Coast Survey set a standard for accuracy by the mid-1800s.
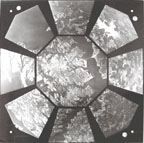
This photograph of Annapolis was taken with a nine-lens camera on December 4, 1942 . U. S. Coast and Geodetic Survey.
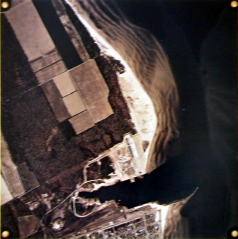
Aerial photograph of Cape Charles, Virginia April 27, 1962. U. S. Coast and Geodetic Survey.
Surveying the Unseen
Surveying below the surface of the water is called hydrographic surveying. The purpose of hydrographic surveying for navigational charting is to measure the depth of water and to locate shoals, channels, banks, and all dangers to navigation.
Early surveyors for the U.S. Coast Survey measured the depth of water with a weighted line, called a "lead line," which was marked to indicate feet or fathoms. The weight was lowered overboard and when it hit bottom, the surveryors then read the markings on the line.
Some lead lines were also used to survey the type of bottom deposits in a given area. These lead lines had an indented lower end into which a lump of tallow was pressed. If the bottom was sandy or muddy, bits of sand or mud stuck to the tallow. If the bottom was rocky, the tallow came up clean.
Hydrographic surveying also involves measuring the tide and tidal currents. "Tide" is defined as the vertical change in the surface of the water, and "tidal current" as the horizontal motion of the water that accompanies the rising and falling of the tide. The earliest tidal observations by the U.S. Coast Survey for the bay began in Annapolis in 1844.
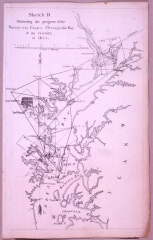
Sketch D. Illustrating the Progress of the Survey of
the Coast in Chesapeake Bay & Its Vicinity in
1844
U.S. Coast Survey
Washington, DC, 1844
Huntingfield Corporation Map Collection, MSA SC
1399-1-469
Triangulation to fix the relative positions of locations
in the Chesapeake Bay began in 1842 with the careful
construction of a base line on Kent Island. This sketch
was included in the first progress report to Congress by
the U.S. Coast Survey. Triangulation provides a rigid,
cohesive network of positions from which charting can be
accomplished.
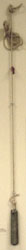
Lead Line
Courtesy of the Calvert Marine Museum, 74.76
A lead line is a weighted line with graduated markings
used to measure water depths, or "soundings." This
particular lead line was used by waterman Ruby Dixon for
locating lumps of oysters.
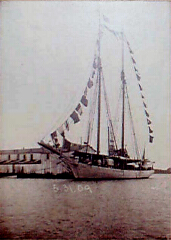
Early surveys by the U.S. Coast and Geodetic Survey were carried out in vessels like the Matchless, a schooner built in Key West, Florida, in 1859. The Matchless was used for the resurvey of the Patuxent River conducted in 1908 to revise and verify the charts. She is shown here on May 31, 1909 at the pier of the Solomons fish and guano factory on Mill Creek.
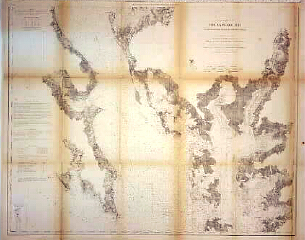
Coast Chart No. 33, Chesapeake Bay from Choptank River
to Potomac River
U.S. Coast Survey
Washington, DC, 1862
Courtesy of Carl Fleischhauer
An example of the early U.S. Coast Survey charts, this
chart reflects the painstaking topographic and
hydrographic work carried out by the agency. Shoals are
indicated with progressively lighter shading as depth
increases. The topography of the shorelines is indicated
and provides valuable information about land use at the
time. For example, you can see that Solomons did not exist
as a community in 1862.
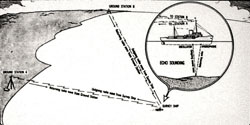
Echo sounding replaced the lead line for hydrographic
surveying. By using a vertical sonar pulse and measuring
the time between emission of the signal and the receipt of
the echo off the bottom, the depth of water can be
accurately calculated.
Echo sounding was developed shortly after the end of the
World War I when the underwater sound-ranging apparatus
was introduced for locating the positions of submerged
submarines. This technology was quickly adapted for use in
marine surveys.
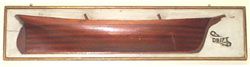
Half model, Drift Courtesy of the Maryland
Historical Society
The Drift was a 76-foot schooner built in Baltimore in
1876. She was used as a survey vessel by the U.S. Coast
and Geodetic Survey. Around the turn of the century she
was also employed by the Lighthouse Board.
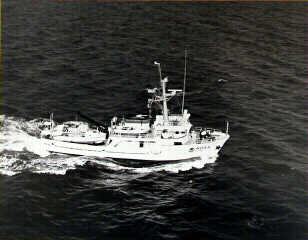
The National Ocean Service now operates the Atlantic Marine Center (AMC) in Norfolk, Virginia, as the East Coast base for the NOAA Fleet. Under the command of a rear admiral in the NOAA Corps, one of the Nation's seven uniform services, the AMC provides logistical and engineering support for the vessels, and processes and compiles hydrographic and photogrammetric survey data. One present-day NOS survey ship which sometimes works in the Chesapeake is the Rude, shown here underway.
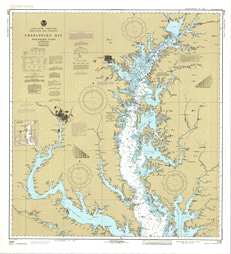
United States--East Coast, Maryland and Virginia:
Chesapeake Bay, Northern Part
National Ocean Service
Washington, DC, 1984
Huntingfield Corporation Map Collection, MSA SC
1399-1-736
This chart includes LORAN "C" lines, which were added to
Chesapeake Bay charts beginning in August 1975. LORAN is
an electronic navigation system, the name derived from the
initial letters of LOng RAnge Navigation. LORAN receives
use pulsed signals from two or more stations to permit the
navigator to find his position with great accuracy.

LORAN C
(Long Range Navigation)
LORAN C indicates the exact location of a vessel in terms
of latitude and longitude. This allows the navigator to
plot his location on a chart and find his way back to
harbor or some other designation.
LORAN C also helps plot a course. By entering a desired
location (WAYPOINT) into LORAN C's memory, it can show
what direction the waypoint is relative to location
(BEARING), the distance to the waypoint (RANGE), how far
off course the skipper is steering (CROSS TRACK ERROR),
how fast the vessel is traveling and in what direction
(SPEED AND COURSE OVER GROUND). By following from one
waypoint to another, a skipper can easily navigate where
he or she could not rely on other navigation methods. Most
LORAN C sets will store up to 100 waypoints.
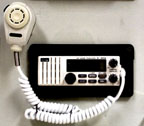
VHF Radio
(Very High Frequency Radio)
VHR radios have a number of channels which are used by
mariners to talk to each other, listen to weather reports,
receive navigation information, send distress calls, and
for other communication purposes.
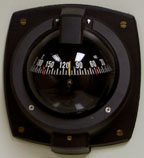
Compass
The compass is the most critical of all navigational
tools. It issues a constant report on the boat's heading
relative to the direction of magnetic north. A compass can
also be used as a sighting instrument to determine the
directional relationship of the boat to some mark on the
shore or on the water.
Knotmeter
The knotmeter measures the boat's speed, important
information for plotting a course.
Depth Sounder
The depth sounder indicates the depth of water beneath the
vessel's hull. Some depth sounders are equipped with an
alarm which alerts the skipper that he or she is in danger
of running aground.
|
This web site is presented for reference purposes under the doctrine of fair use. When this material is used, in whole or in part, proper citation and credit must be attributed to the Maryland State Archives. PLEASE NOTE: The site may contain material from other sources which may be under copyright. Rights assessment, and full originating source citation, is the responsibility of the user. |
© Copyright December 15, 2023 Maryland State Archives