
Charting the Chesapeake 1590 - 1990
- Introduction
- Maps for Mariners
- Charts for Marylanders
- Chartmaking I: Copperplates to Computers
- Chartmaking II: Surveying the Seen and Unseen
- The Language of Charts
- Cartographers of the Chesapeake

Chartmaking I: Copperplates to Computers
The Copperplate Process
Map and chartmakers preferred to use copper for engraving
because it was stable, yet soft enough to permit correcting.
They used copperplates for map and chart reproduction for
well over three hundred years, during the seventeenth,
eighteenth, and nineteenth centuries. This process
reproduced maps with intricate detail and tone
variations.
The process involved the following:
- The chartmaker incised the features of the chart into the surface of the smooth, polished copper plate. Using a sharp tool, he cut the lines, removing a narrow vee-shaped section from the surface. This was a painstaking, slow, and expensive procedure, made even more difficult by the fact that it had to be done as a mirror image.
- The chartmaker applied ink to the entire surface of the copperplate, making sure the ink filled the incised design.
- He wiped off the excess ink, leaving a small amount in the incised design and lettering.
- Next, he placed a sheet of paper over the plate. The paper was slightly moistened to make it more flexible.
- The chartmaker placed padding (often sheepskin) over the paper, pressing it firmly against the paper and plate so that the paper made contact with the inked incised areas. This was usually done by racking the plate, paper, and padding between metal rolls.
- Finally, the chartmaker removed the padding and stripped away the paper which bore ink from the incised areas.
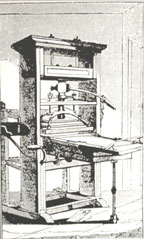
William Blaeu employed the best pressmen, engravers,
scribes and colorist in the Netherlands. His types were
clean and well cut while his paper was heavy and of good
quality. Blaeu designed and built an improved printing
press.
Reproduced from The Story of Maps by Lloyd A. Brown,
1949.s of the tidewater area published from 1612 to
1673, it was not terribly useful as a chart since it
lacked the detailed information needed for navigation
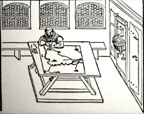
An early woodcut illustration of a cartographer at work.
From Paul Pfintzing's Methodus Geometrica, first printed
in Nuremberg, 1598.
Reproduced from The Story of Maps by Lloyd A. Brown,
1949.
Lithography
Lithography is a printing process that was introduced in the
United States from Europe during the early years of the
nineteenth century. Since the process was faster than
copperplate engraving the U.S. Coast Survey used
lithographic printing to fill the great demand for charts at
the start of the Civil War.
The process involves the following:
- The image to be printed is rendered with an oily or waxy material on a flat surface. Early lithographers used a smooth stone for this purpose while sheet zinc or aluminum is used now. As with copperplate engraving, the chart is drawn as a mirror image.
- The chartmaker dampened the stone, then rolled ink over its surface. The ink adhered to the image but was repelled by the dampened parts.
- Placing a sheet of paper on the stone, the chartmaker passed the stone and paper though a press.
- He peeled away the paper which carried the inked image.
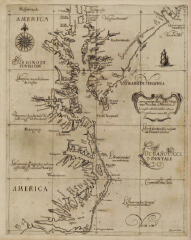
Carta Particolare Della Virginia Vecchia E Nuoua
Sir Robert Dudley
Florence, Italy, 1646
Huntingfield Corporation Map Collection, MSA SC
1399-1-536
This was the first chart of the Chesapeake area to use the
Mercator projection. It and others in the rare marine
atlas Arcano Del Mare are considered among the most
beautiful engraved charts of the seventeenth century. The
copperplate engravings in the atlas took twelve years to
make and used five thousand pounds of copper.
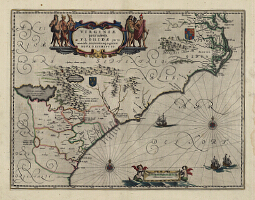
Virginia partis australis...
William Janszoon Blaeu
Amsterdam, 1640
Huntingfield Corporation Map Collection, MSA SC
1399-1-563
This is an example of a beautifully engraved chart from
the Dutch publisher William Janszoon Blaeu and his sons
John and Cornelius. Blaeu was a highly respected man of
science who held the title of Map Maker to the Republic.
Yet many of his maps and charts, such as this one, are not
scientifically accurate. Some scholars believe that Blaeu
was a shrewd businessman who made two kinds of charts: one
to please the eye that tended toward bright colors and
gold leaf; the other for seamen and officials who knew and
demanded the best in scientific documents. Blaeu's working
maps and charts were most likely worn out or destroyed as
a safety measure, while his beautiful maps and atlases,
because they were locked up in a gentleman's library and
never disturbed, have survived.
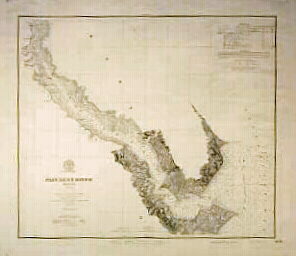
Patuxent River Maryland, Lower Part
U.S. Coast and Geodetic Survey
Washington, DC, 1897
National Oceanic and Atmospheric Admin., National Ocean
Survey
This print was made directly from the a copperplate. It is
the same basic chart as the 1859 preliminary chart of the
Patuxent River but it includes topographic
characteristics. It also includes two lighthouses that did
not exist in 1859, Drum Point Lighthouse and Cedar Point
Lighthouse, marking the entrance to the Patuxent River.
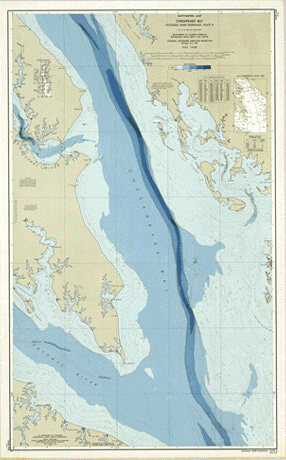
Bathymetric Map -- Chesapeake Bay: Potomac River
Entrance--Plate 8
National Ocean Service
Washington, DC, 1970
Huntingfield Corporation Map Collection, MSA SC
1399-1-743
This colorful map is an example of a modern printing
chart. Its coloring illustrates the Chesapeake Bay as a
drowned river valley with a narrow, deep channel. The Bay
was formed when the Susquehanna River flooded 15,000 years
ago with the melting of the glaciers in the last ice age.
|
This web site is presented for reference purposes under the doctrine of fair use. When this material is used, in whole or in part, proper citation and credit must be attributed to the Maryland State Archives. PLEASE NOTE: The site may contain material from other sources which may be under copyright. Rights assessment, and full originating source citation, is the responsibility of the user. |
© Copyright December 15, 2023 Maryland State Archives