
Charting the Chesapeake 1590 - 1990
- Introduction
- Maps for Mariners
- Charts for Marylanders
- Chartmaking I: Copperplates to Computers
- Chartmaking II: Surveying the Seen and Unseen
- The Language of Charts
- Cartographers of the Chesapeake

Charts for Marylanders
Because the Chesapeake Bay has been so important to the history of Maryland, charts have played a central role as well. From the seventeenth century forward charts were the key to economic or naval power.
Charts were indispensable to Maryland's early vessels of commerce and trade, such as the tobacco ships which transported the region's cash crop to market in Europe. They were also essential to both the British and American navies during the Revolutionary War and the War of 1812. Sailors needed to know the location of shoals, conditions of the bottom, and the ways of tide and current to maneuver their vessels during battles on the Chesapeake and its tributaries.
Today's Marylanders also rely on charts of the Chesapeake to find their way. Maryland pilots use charts to guide foreign container vessels into and out of the bay's major ports, Baltimore and Norfolk. Millions of recreational boaters consult charts to navigate to safe harbor. They are also used by watermen to locate the bay's natural oyster beds.
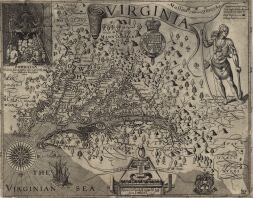
Virginia
John Smith
Oxford, England, 1612
Huntingfield Corporation Map Collection, MSA SC 1399-1-101
Captain John Smith's map was the first detailed drawing of the Chesapeake Bay's shoreline configuration. This map and its derivatives lured immigrants to the region as Europeans became aware of the bay, its extensive river system, and open land. While John Smith's map served as the prototype for a number of charts of the tidewater area published from 1612 to 1673, it was not terribly useful as a chart since it lacked the detailed information needed for navigation
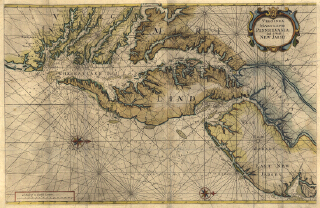
Virginia, Maryland, Pennsilvania, East & West New Jarsey
John Thornton
London, 1689
Huntingfield Corporation Map Collection, MSA SC 1399-1-482
Thornton's chart was the earliest usable chart of the Chesapeake Bay. Based on Augustine Herrman's enormous four-sheet map map of 1673, this one-sheet version was used by captains of the rapidly growing tobacco fleet. Various publishers continued to print this chart for over a century, long after better charts had rendered it obsolete.
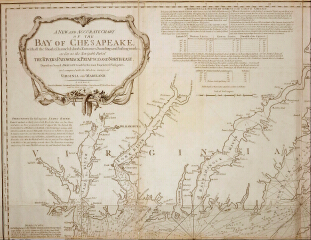
A New and Accurate Chart of the Bay of Chesapeake, with all the Shoals, Channels, Islands, Entrances, Soundings and Sailing-marks
Anthony Smith, attributed
London, 1776
Huntingfield Corporation Map Collection, MSA SC 1399-1-427
This chart, attributed to St. Mary's County pilot Anthony Smith, was used by both British and American naval forces in the Revolutionary War and the War of 1812. It augmented the soundings and bottom conditions on the Hoxton chart of 1735, gave greater coverage of the rivers, and added a longitudinal scale and sailing directions.
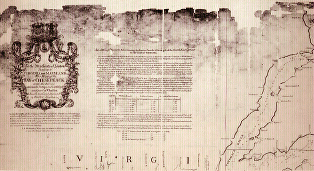
To the Merchants of London Trading to Virginia and Maryland, this Mapp of Chesapeack
Walter Hoxton
London, 1735
Courtesy of the Maryland Historical Society
Water Hoxton was a British tobacco ship captain whose twenty-three voyages to Maryland provided him with personal knowledge of the bay. He recorded his observations and discoveries on this chart, the first to show extensive soundings and shoals. Hoxton's chart was also the first of the bay to indicate magnetic variation. Because Hoxton's chart was the best available guide to the bay, few copies survived their hard usage.
Chart No. 20, Natural Oyster Bars, Calvert and St. Mary's Counties, Maryland
U.S. Coast Survey
Washington, DC, 1908
Courtesy of the Calvert Marine Museum, 69.82.1
This chart was one of forty-three produced by the Maryland Oyster Survey, a cooperative effort between the Maryland Shell Fish Commission, the United States Bureau of Fisheries, and the United States Coast & Geodetic Survey. The oyster survey was conducted from 1906 to 1912 under the provision of an act of Congress to survey "the natural oyster beds, bars, and rocks in the waters within the State of Maryland." The purpose of the survey was to promote economic development of the oyster industry. By identifying the boundaries of the bay's natural oyster beds, efforts could be made to protect them while barren areas could be cultivated. The total area covered by the survey was 1,600 square miles.
|
This web site is presented for reference purposes under the doctrine of fair use. When this material is used, in whole or in part, proper citation and credit must be attributed to the Maryland State Archives. PLEASE NOTE: The site may contain material from other sources which may be under copyright. Rights assessment, and full originating source citation, is the responsibility of the user. |
© Copyright December 15, 2023 Maryland State Archives