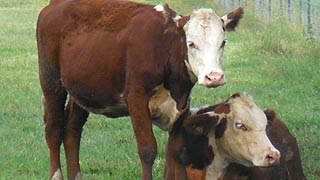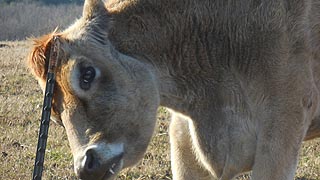

Cattle, Kinder Farm Park, Millersville, Maryland, August 2019 (left), January 2019 (right). Photos by Diane F. Evartt.
| 2020 | 2021 | 2022 | 2023 | ||
| Dairy Products, Milk | $151,902,000 | $157,108,000 | $213,504,000 | $183,522,000 | |
| Feed Crops (barley, corn, hay) | $340,380,000 | $399,514,000 | $419,528,000 | $356,014,000 | |
| Food Grains (wheat) | $60,122,000 | $86,465,000 | $92,363,000 | $91,946,000 | |
| Fruits & Nuts (includes apples, peaches) | |||||
| Livestock (miscellaneous) & Products (includes honey, wool) | $83,334,000 | $76,951,000 | $71,233,000 | $71,334,000 | |
| Meat Animals (includes cattles, calves, hogs) | $70,155,000 | $92,365,000 | $99,476,000 | $98,463,000 | |
| Oil Crops (primarily soybeans) | $240,765,000 | $280,015,000 | $325,325,000 | $262,358,000 | |
| Other Crops (includes floriculture, mushrooms) | $392,431,000 | $462,470,000 | $506,244,000 | $502,225,000 | |
| Poultry & Eggs (broilers, chickens, eggs, turkeys) | $724,340,000 | $967,783,000 | $1,603,678,000 | $1,373,090,000 | |
| Vegetables & Melons (includes potatoes, beans, corn, cucumbers, peas, spinach, cantaloupes, watermelon) | |||||
| TOTAL | $2,063,429,000 | $2,522,671,000 | $3,331,302,000 | $2,938,952,000 | |
| 2015 | 2016 | 2017 | 2018 | 2019 | |
| Dairy Products, Milk | $172,480,000 | $156,292,000 | $168,744,000 | $148,554,000 | $153,088,000 |
| Feed Crops (barley, corn, hay) | $263,180,000 | $251,835,000 | $252,894,000 | $264,671,000 | $281,123,000 |
| Food Grains (wheat) | $74,307,000 | $70,608,000 | $61,233,000 | $63,374,000 | $59,956,000 |
| Fruits & Nuts (includes apples, peaches) | $12,740,000 | $13,724,000 | $14,542,000 | ||
| Livestock (miscellaneous) & Products (includes honey, wool) | $41,237,000 | $44,435,000 | $85,949,000 | $99,437,000 | $99,440,000 |
| Meat Animals (includes cattles, calves, hogs) | $104,021,000 | $85,590,000 | $68,656,000 | $75,821,000 | $97,537,000 |
| Oil Crops (primarily soybeans) | $181,813,000 | $209,078,000 | $201,226,000 | $197,807,000 | $182,556,000 |
| Other Crops (includes floriculture, mushrooms) | $312,386,000 | $322,619,000 | $338,091,000 | $315,344,000 | $359,024,000 |
| Poultry & Eggs (broilers, chickens, eggs, turkeys) | $1,050,994,000 | $938,532,000 | $1,062,624,000 | $1,044,813,000 | $942,875,000 |
| Vegetables & Melons (includes potatoes, beans, corn, cucumbers, peas, spinach, cantaloupes, watermelon) | $38,977,000 | $42,996,000 | $45,460,000 | $40,174,000 | |
| TOTAL | $2,252,135,000 | $2,135,709,000 | $2,299,418,000 | $2,246,995,000 | $2,175,598,000 |

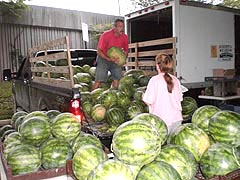
 Baltimore Farmers' Market (left), Holliday St. & Saratoga St., Baltimore, Maryland, August 2013. Photo by Diane F. Evartt.
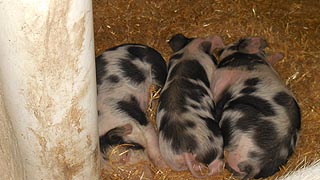
Piglets (right), Kinder Farm Park, Millersville, Maryland, January 2019. Photo by Diane F. Evartt.
| 2010 | 2011 | 2012 | 2013 | 2014 | |
| Dairy Products, Milk | $182,896,000 | $204,906,000 | $187,596,000 | $202,521,000 | $246,000,000 |
| Feed Crops (barley, corn, hay) | $245,035,000 | $270,905,000 | $338,038,000 | $331,653,000 | $315,440,000 |
| Food Grains (wheat) | $39,522,000 | $58,712,000 | $104,383,000 | $107,050,000 | $98,464,000 |
| Fruits & Nuts (includes apples, peaches) | $12,209,000 | $14,850,000 | $19,017,000 | $10,508,000 | $14,964,000 |
| Livestock (miscellaneous) & Products (includes honey, wool) | $25,355,000 | $28,425,000 | $31,448,000 | $34,900,000 | $38,161,000 |
| Meat Animals (includes cattles, calves, hogs) | $72,861,000 | $75,847,000 | $128,665,000 | $110,321,000 | $104,932,000 |
| Oil Crops (primarily soybeans) | $187,462,000 | $168,189,000 | $270,653,000 | $276,340,000 | $221,255,000 |
| Other Crops (includes floriculture, mushrooms) | $325,061,000 | $292,765,000 | $266,333,000 | $279,900,000 | $286,593,000 |
| Poultry & Eggs (broilers, chickens, eggs, turkeys) | $742,218,000 | $812,099,000 | $870,144,000 | $1,051,968,000 | $1,080,052,000 |
| Vegetables & Melons (includes potatoes, beans, corn, cucumbers, peas, spinach, cantaloupes, watermelon) | $37,661,000 | $43,404,000 | $44,959,000 | $39,026,000 | $43,492,000 |
| TOTAL | $1,870,280,000 | $1,970,102,000 | $2,261,237,000 | $2,444,187,000 | $2,449,352,000 |
![[photo, Baltimore Farmers' Market, Holliday St. and Saratoga St., Baltimore, Maryland]](/msa/mdmanual/01glance/agriculture/images/1198-1-2548.jpg)
Baltimore Farmers' Market, Holliday St. & Saratoga St., Baltimore, Maryland, November 2007. Photo by Diane F. Evartt.
| 2005 | 2006 | 2007 | 2008 | 2009 | |
| Dairy Products, Milk | $183,870,000 | $151,524,000 | $208,800,000 | $194,180,000 | $144,565,000 |
| Feed Crops (barley, corn, hay, oats) | $122,702,000 | $142,393,000 | $165,264,000 | $199,897,000 | $214,478,000 |
| Food Grains (rye, wheat) | $26,611,000 | $33,632,000 | $56,561,000 | $63,414,000 | $49,487,000 |
| Fruits & Nuts | $15,117,000 | $16,890,000 | $18,359,000 | $11,714,000 | $11,362,000 |
| Livestock (miscellaneous) & Products | $19,935,000 | $17,787,000 | $16,830,000 | $18,724,000 | $22,359,000 |
| Meat Animals | $89,322,000 | $91,596,000 | $86,466,000 | $73,233,000 | $58,997,000 |
| Oil Crops (primarily soybeans) | $85,818,000 | $86,248,000 | $96,417,000 | $109,266,000 | $173,327,000 |
| Other Crops (includes greenhouse/nursery, floriculture) | $224,147,000 | $222,564,000 | $226,988,000 | $318,322,000 | $365,817,000 |
| Poultry & Eggs | $678,850,000 | $648,627,000 | $790,023,000 | $817,241,000 | $684,806,000 |
| Tobacco** | $2,674,000 | ||||
| Vegetables & Melons | $71,214,000 | $59,664,000 | $73,956,000 | $42,667,000 | $41,362,000 |
| TOTAL | $1,520,260,000 | $1,470,925,000 | $1,739,664,000 | $1,848,658,000 | $1,766,560,000 |
![[photo, Hen, Annapolis, Maryland]](/msa/mdmanual/01glance/images/1198-1-493.jpg)
Hen, Annapolis, Maryland, August 2003. Photo by Diane F. Evartt.
| 2000 | 2001 | 2002 | 2003 | 2004 | |
| Dairy Products, Milk | $181,035,000 | $208,008,000 | $170,412,000 | $155,477,000 | $188,360,000 |
| Feed Crops (barley, corn, hay, oats) | $110,083,000 | $119,970,000 | $98,847,000 | $114,774,000 | $149,292,000 |
| Food Grains (rye, wheat) | $23,296,000 | $27,855,000 | $35,561,000 | $17,336,000 | $28,123,000 |
| Fruits & Nuts | $13,319,000 | $12,290,000 | $11,659,000 | $13,359,000 | $12,977,000 |
| Livestock (miscellaneous) & Products | $55,708,000 | $47,946,000 | $48,419,000 | $7,248,000 | $8,039,000 |
| Meat Animals | $76,125,000 | $68,916,000 | $74,119,000 | $89,133,000 | $86,685,000 |
| Oil Crops (primarily soybeans) | $85,367,000 | $80,935,000 | $62,118,000 | $81,081,000 | $110,934,000 |
| Other Crops (includes greenhouse/nursery, floriculture) | $291,870,000 | $307,198,000 | $334,257,000 | $225,611,000 | $238,167,000 |
| Poultry & Eggs | $522,494,000 | $604,612,000 | $491,060,000 | $546,578,000 | $680,904,000 |
| Tobacco | $15,106,000 | $13,620,000 | $5,938,000 | $5,119,000 | $2,292,000 |
| Vegetables & Melons | $68,232,000 | $61,983,000 | $59,761,000 | $66,743,000 | $59,827,000 |
| TOTAL | $1,442,635,000 | $1,553,333,000 | $1,392,151,000 | $1,322,459,000 | $1,565,600,000 |
![[photo, Grazing cows, farmland, Frederick County, Maryland]](/msa/mdmanual/10dag/images/i002130b.jpg)
Grazing cows, farmland, Frederick County, Maryland, 1998. Photo by Diane P. Frese.
| 1995 | 1996 | 1997 | 1998 | 1999 | |
| Dairy Products, Milk | $175,560,000 | $199,206,000 | $181,608,000 | $208,967,000 | $203,250,000 |
| Feed Crops (barley, corn, hay, oats) | $81,794,000 | $171,987,000 | $119,643,000 | $95,373,000 | $78,372,000 |
| Food Grains (rye, wheat) | $55,731,000 | $53,695,000 | $43,680,000 | $25,371,000 | $24,266,000 |
| Fruits & Nuts | $13,481,000 | $12,364,000 | $18,313,000 | $15,264,000 | $13,746,000 |
| Livestock (miscellaneous) & Products | $66,886,000 | $66,905,000 | $72,209,000 | $61,007,000 | $61,823,000 |
| Meat Animals | $77,605,000 | $61,577,000 | $80,131,000 | $70,735,000 | $70,341,000 |
| Oil Crops (primarily soybeans) | $72,939,000 | $101,346,000 | $109,880,000 | $82,220,000 | $66,446,000 |
| Other Crops (includes greenhouse/nursery, floriculture) | $256,120,000 | $260,584,000 | $265,883,000 | $283,090,000 | $280,092,000 |
| Poultry & Eggs | $528,266,000 | $589,025,000 | $599,919,000 | $601,384,000 | $592,871,000 |
| Tobacco | $20,869,000 | $19,202,000 | $18,091,000 | $15,761,000 | $14,833,000 |
| Vegetables & Melons | $70,727,000 | $72,892,000 | $73,200,000 | $68,667,000 | $77,081,000 |
| TOTAL | $1,419,978,000 | $1,608,783,000 | $1,582,557,000 | $1,527,839,000 | $1,483,121,000 |
| 1990 | 1991 | 1992 | 1993 | 1994 | |
| Dairy Products, Milk | $203,588,000 | $183,040,000 | $200,760,000 | $186,260,000 | $181,525,000 |
| Feed Crops (barley, corn, hay, oats) | $111,901,000 | $86,667,000 | $89,374,000 | $65,115,000 | $70,196,000 |
| Food Grains (rye, wheat) | $26,564,000 | $23,421,000 | $35,181,000 | $29,904,000 | $36,361,000 |
| Fruits & Nuts | $9,808,000 | $14,908,000 | $12,427,000 | $11,577,000 | $11,648,000 |
| Livestock (miscellaneous) & Products | $47,600,000 | $51,271,000 | $40,243,000 | $61,701,000 | $61,543,000 |
| Meat Animals | $112,062,000 | $108,341,000 | $84,417,000 | $109,468,000 | $82,057,000 |
| Oil Crops (primarily soybeans) | $98,857,000 | $93,256,000 | $91,878,000 | $89,975,000 | $93,885,000 |
| Other Crops (includes greenhouse/nursery, floriculture) | $189,682,000 | $213,416,000 | $230,653,000 | $251,778,000 | $249,604,000 |
| Poultry & Eggs | $459,878,000 | $452,096,000 | $459,994,000 | $478,663,000 | $490,042,000 |
| Tobacco | $18,041,000 | $17,658,000 | $20,898,000 | $20,020,000 | $18,530,000 |
| Vegetables & Melons | $84,400,000 | $92,225,000 | $65,314,000 | $62,348,000 | $65,668,000 |
| TOTAL | $1,362,381,000 | $1,336,299,000 | $1,331,139,000 | $1,366,809,000 | $1,361,059,000 |
Maryland Government
Maryland Constitutional Offices & Agencies
Maryland Departments
Maryland Independent Agencies
Maryland Executive Commissions, Committees, Task Forces, & Advisory Boards
Maryland Universities & Colleges
Maryland Counties
Maryland Municipalities
Maryland at a Glance
Search the Manual
e-mail: mdmanual@maryland.gov
|
|| Search the Archives || Education & Outreach || Archives of Maryland Online ] Governor General Assembly Judiciary Maryland.Gov
|