|
Z 1-23
COLONIAL AND PRE-FEDERAL STATISTICS
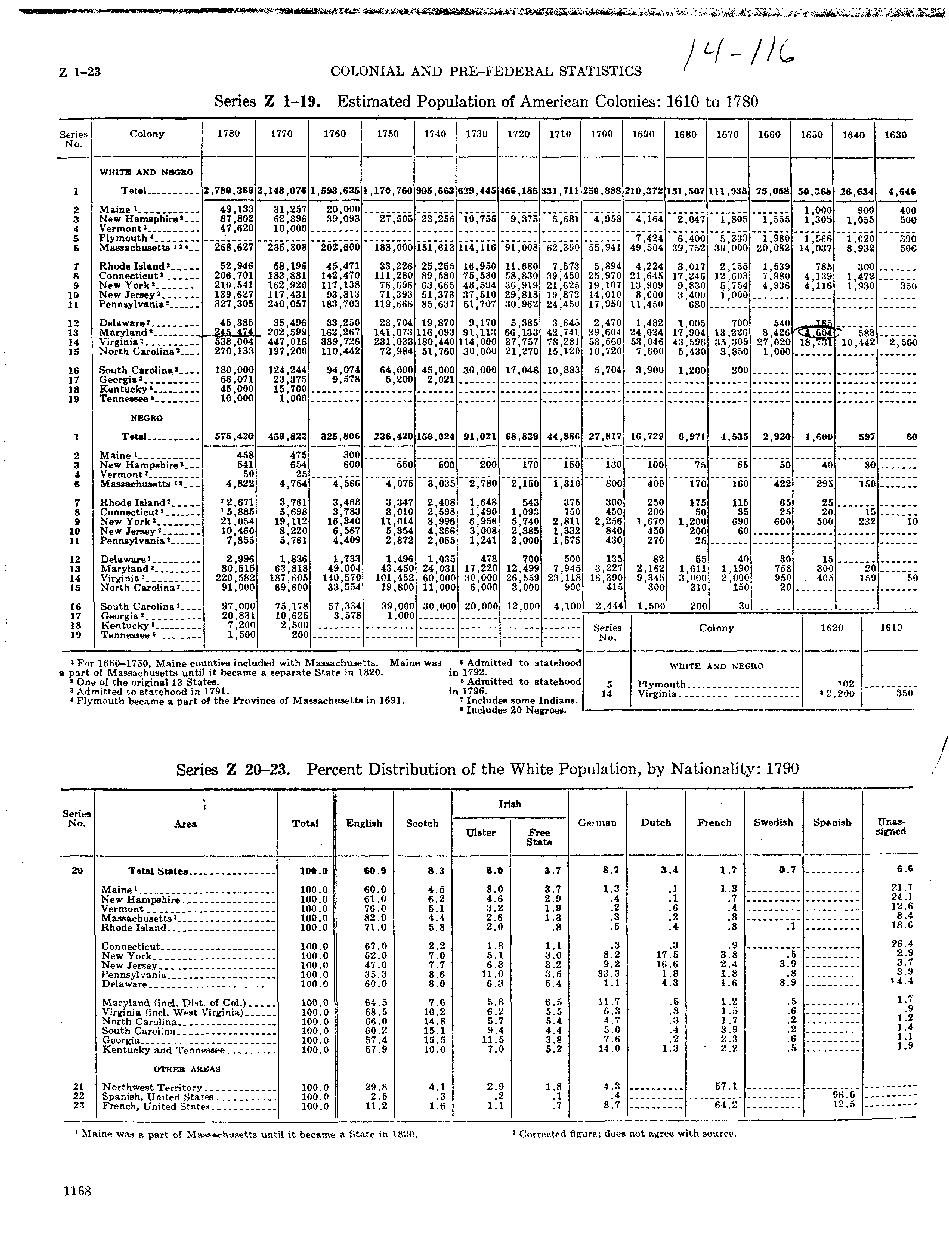
Series Z 1-19. Estimated Population of American Colonies: 1610 to 1780
Series No.
Colony
1780
1770
1760
1750
1740
1730
1720
1710
1700
1690
1680
1670
1660
1650
1640
1630
1
2 3 4 5 6
7 8 9 10 11
12 13 14 15
16 17 18 19
1
2 3 4 6
7 8 9 10 11
12 13 14 15
16 17 18 19
WHITE AND NBGKO
Total. ____ ..
2,780,369
2,148,076
1,593,625
1,170,760
905,563
629,445
466,185
331,711
230,888
210,372
151,507
111,935
75,058
50, .16*
26,634
4,646
49,133 87,802 47,620
31,257 62,396 10,000
20,000 39,093
1,000 1,305
900 1,055
400 500
New Hamsphire'...
27,505
23,256
10,756
9,375
5,681
4,958
4,164
2,047
1,805
1,555
7,424 49,504
4,224 21,645 13,909 8,000 11,450
1,482 24 ,024 53,046 7,600
3,900
6,400 39,752
3,017 17,246 9,830 3,400 680
1,005 17,904 43,596 5,430
1,200
5,333 30,000
2,155 12,603 5,754 1,000
1,980 20,082
1,539 7,980 4,936
1,566 14,037
785 4,139 4,116
1,020 8,932
300 1,472 1,930
390 506
Massachusetts l * *_ _ Rhode Island'. ....
268,627
52,946 206,701 210,541 139,627 327,305
45,385 24S 474
235,308
58,196 183,881 162,920 117,431 240,057
35,496 . 202,599
202,600
45,471 142,470 117,138 93,813 183,703
33,250 162,267 339,726 110,442
94,074 9,578
188,000
33,226 111,280 76,696 71,393 119,666
28,704 141,073 231,033 72,984
64,000 5,200
151,613
25,255 89,580 63,665 51,373 85,637
19,870 116,093 180,440 51,760
45,000 2,021
114,116
16,950 75,530 48,594 37,510 51,707
9,170 91,113 114,000 30,000
30,000
91,008
11,680 58,830 36,919 29,818 30,962
5,385 66,133 87,757 21,270
17,048
62,390
7,573 39,450 21,625 19 872 24,450
3,645
42,741 78,281 15,120
10,883
55,941
5,894 25,970 19,107 14,010 17,950
2,470 29,604 58,560 10,720
5,704
New York'.......-
350
Delaware '.___.._-_
700 13,226 35,309 3,850
200
540 8,426 27,020 1,000
is * lyvY
lO , I OL
1? 583 10,442
538,004 270,133
180,000 56,071 45,000 10,000
675,420
447,016 197,200
124,244 23,375 15,700 1,000
459,822
2,500
North Carolina' _ . South Carolina'....
NEGRO Total..... .....
325,806
236,420
150,024
91 ,021
68,8.19
44,866
27,817
10,729
6,971
4,535
2,920
1 ,660
597
60
458 541 50 4,822
'2,671 '5,885 21,054 10,460 7,855
2,996 80,515 220,582 91,000
97,000 20,831 7,200 1,500
475 654 25 4,754
3,761 5,698 19,112 8,220 5,761
1,836 63,818 187,605 69,600
75,178 10,625 2,500 200
300 600
New Hampshire '__-
550
500
200
170
150
130
100
75
65
50
40
30
Massachusetts 1'_ . _ Rhode Island'.... -
4,566
3,468 3,783 16,340 6,567 4,409
1,733 49,004 140,570 33,554
57,334 3,578
4,075
3,347 3,010 11,014 5,354 2,872
1,496 43,450 101,452 19,800
39,000 1,000
3,035
2,408 2,598 8,996 4,366 2,055
1,035 24,031 60,000 11,000
30,000
2,780
1,648 1,490 6,956 3,008 1,241
478 17,220 30,000 6,000
20,000
2,150
543 1,095 5,740 2,385 2,000
700 12,499 26,559 3,000
12,000
1,310
375 750 2,811 1,332
1,575
500 7,945 23,118 900
4,100
800
300 450 2,256 840 430
135
3,227 16,390 415
2,444
400
250 200 1,670 450
270
82 2,162 9,345 300
1,500
170
175
50 1,200 200 25
55 1,611 3,000 210
200
160
115
35 690 60
422
65 25 600
295
25 20 500
150
15 232
New York'. .......
10
40 1,190 2,000 150
30
30
758 950 20
15
300 . 405
20 150
50
North Carolina' _ . South Carolina' ...
Georgia'. ________
Series No.
Colony 1620 1610
1 For 1660-1750, Maine counties included with Massachusetts. Maine was ' Admitted to statehooc it part of Massachusetts until it became a separate State in 1820. in 1792. ' One of the original 13 States. fl Admitted to statehood 3 Admitted to statehood in 1791. in 1796. 4 Plymouth became a part of the Province of Massachusetts in 1691. 7 Includes some Indians.
5 14
Plym
Virgin
WHITE AND NEGRO 3Uth 102
ia. ....... .............. «2
200 350
Series Z 20-23. Percent Distribution of the White Population, by Nationality: 1790
Series
t
Iri
sh
No.
Area
Total
English
Scotch
Ulster
Free State
German
Dutch
French
Swedish
Spanish
llnas-sijrned
20
60.9
8.3
3.7
8.7
3.4
1,7
0.7
6.6
60.0
4.5
8.0
3.7
1.3
.1
1.3
81.1
100.0
61.0
6.2
2.9
.4
.1
.7
24.1
100.0
5.1
3.2
1.9
.2
.6
.4
12.6
82.0
4.4
2.6
1.3
.3
.2
.8
8.4
100.0
71.0
5.8
2.0
.8
.5
.4
.8
.1
18.6
100.0
67.0
2.2
1.1
.3
.3
.9
26.4
NewYork_. __ ....... __ . ....
100.0
52.0
7.0
5.1
3.0
8.2
17.5
3.8
.5
2.9
7.7
6.3
3.2
9.2
16.6
2.4
3 9
3.7
100.0
35.3
8.6
11.0
33.3
1.8
1.8
.8
3.9
100.0
60.0
8.0
6.3
5.4
1.1
4.3
1.6
8.9
>4.4
100.0
64.5
5ft
6.5
11.7
.5
1.2
.5
1.7
68.5
10.2
6.2
5.5
6.3
.3
1.5
.6
.9
100.0
66.0
14.8
5.7
5.4
4.7
.3
1.7
.2
1.2
60.2
15.1
9.4
4.4
5.0
.4
3.9
.2
1.4
100.0
57.4
11.5
3.8
7.6
.2
2.3
.6
1.1
100.0
10.0
7.0
5.2
14.0
1.3
' 2.2
.5
1.9
21
OTHER ARKAa
Northwest Territory . ............
100.0
29.8
4.1
2.9
1.8
4.3
57.1
22
Spanish, United States __ . ......
100.0 100.0
2.5 11.2
.3 1.6
.2
1.1
.1
.7
8.7
9K.5 12.5
._---
1 Maine was a part of M
until it became a State in 1820.
3 Corrected figure; does not agree with source.
1168
�
|

