|
17
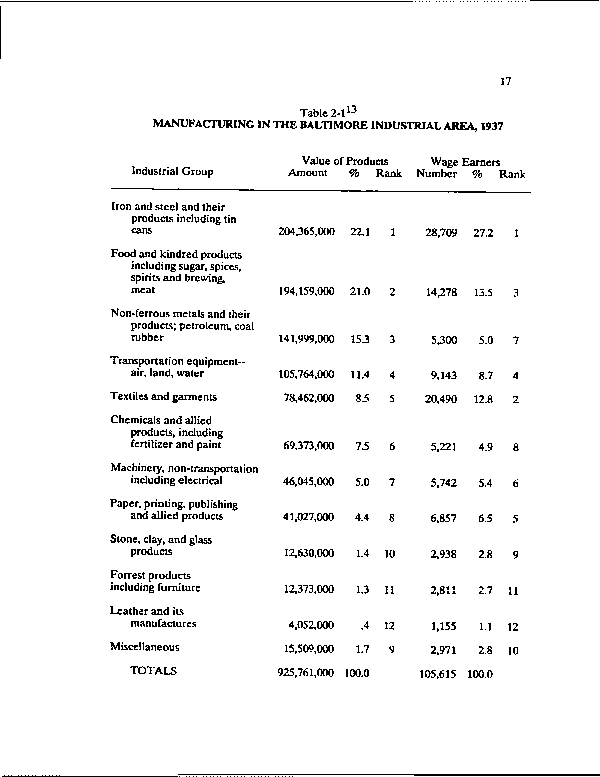
Table 2-113
MANUFACTURING IN THE BALTIMORE INDUSTRIAL AREA, 1937
Industrial Group
Value of Products Wage Earners
Amount % Rank Number % Rank
Iron and steel and their
products including tin
cans
Food and kindred products
including sugar, spices,
spirits and brewing,
meat
Non-ferrous metals and their
products; petroleum, coal
rubber
Transportation equipment-
air, land, water
Textiles and garments
Chemicals and allied
products, including
fertilizer and paint
Machinery, non-transportation
including electrical
Paper, printing, publishing
and allied products
Stone, clay, and glass
products
Forrest products
including furniture
Leather and its
manufactures
Miscellaneous
TOTALS
204,365,000 22.1 1
194,159,000 21.0 2
141,999,000 153 3
105,764,000 11.4 4
78,462,000 8.5 5
28,709 27.2 1
14,278 13.5 3
5,300 5.0 7
9,143 8.7 4
20,490 12.8 2
69,373,000
15
6
5,221
4.9
8
46,045,000
5.0
7
5,742
5.4
6
41,027,000
4.4
8
6,857
6.5
5
12,630,000
1.4
10
2,938
2.8
9
12,373,000
1.3
11
2,811
2.7
11
4,052,000
.4
12
1,155
1.1
12
15,509,000
1.7
9
2,971
2.8
10
925,761,000
100.0
105,615
100.0
|