|
41
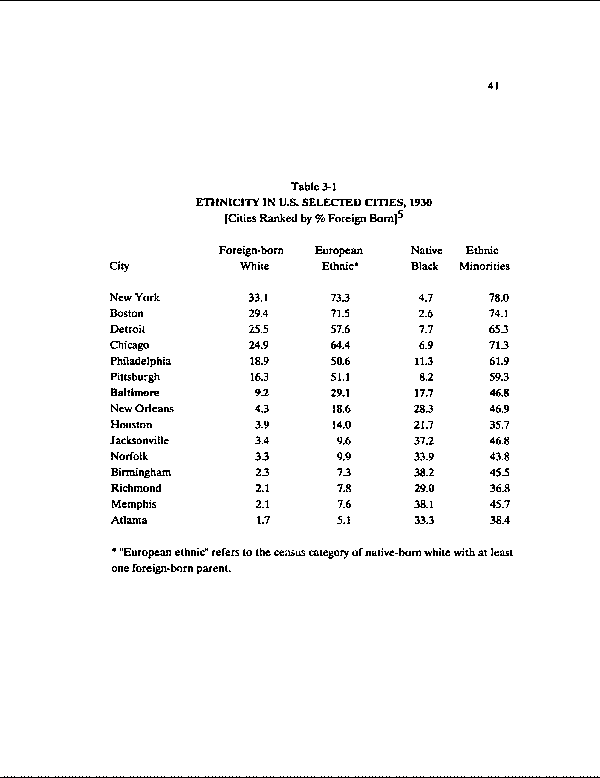
Table 3-1
ETHNICITY IN U.S. SELECTED CITIES, 1930
[Cities Ranked by % Foreign Born]5
Foreign-born
European
Native
Ethnic
City
White
Ethnic*
Black
Minorities
New York
33.1
733
4.7
78.0
Boston
29.4
71.5
2.6
74.1
Detroit
25.5
57.6
7.7
653
Chicago
24.9
64.4
6.9
71.3
Philadelphia
18.9
50.6
11.3
61.9
Pittsburgh
163
51.1
8.2
593
Baltimore
9.2
29.1
17.7
46.8
New Orleans
4.3
18.6
28.3
46.9
Houston
3.9
14.0
21.7
35.7
Jacksonville
3.4
9.6
37.2
46.8
Norfolk
3.3
9.9
33.9
43.8
Birmingham
23
73
38.2
45.5
Richmond
2.1
7.8
29.0
36.8
Memphis
2.1
7.6
38.1
45.7
Atlanta
1.7
5.1
333
38.4
* "European ethnic" refers to the census category of native-born white with at least
one foreign-born parent.
|

