|
MARYLAND SLAVE POPULATION 43
TABLE III
PROFILE OF SLAVES IN CHARLES AND PRINCE GEORGE'S COUNTIES,
MARYLAND, 1711 TO 1730
1711-1720 1721-1730
Males 0-15 84 185
Females 0-15 78 164
Sex ratio 1.077 1.128
Sex unknown 0-15 20 34
Total 0-15 182 383
Males 16-50 209 287
Females 16-50 120 188
Sex ratio 1.742 1.526
Total 16-50 329 475
Old males 26 53
Old females 21 47
Sex ratio 1.238 1.128
Old sex unknown 3 2
Total old 50 102
Slaves, age, sex unknown 34 14
Total slaves 595 974
ratio 0-15/16-50 .553 .806
ratio 0-15/females 16-50 1.517 2.037
ratio females 0-15 /females
16-50 .733 .963
Assuming that Vi of the children not identified by sex were females.
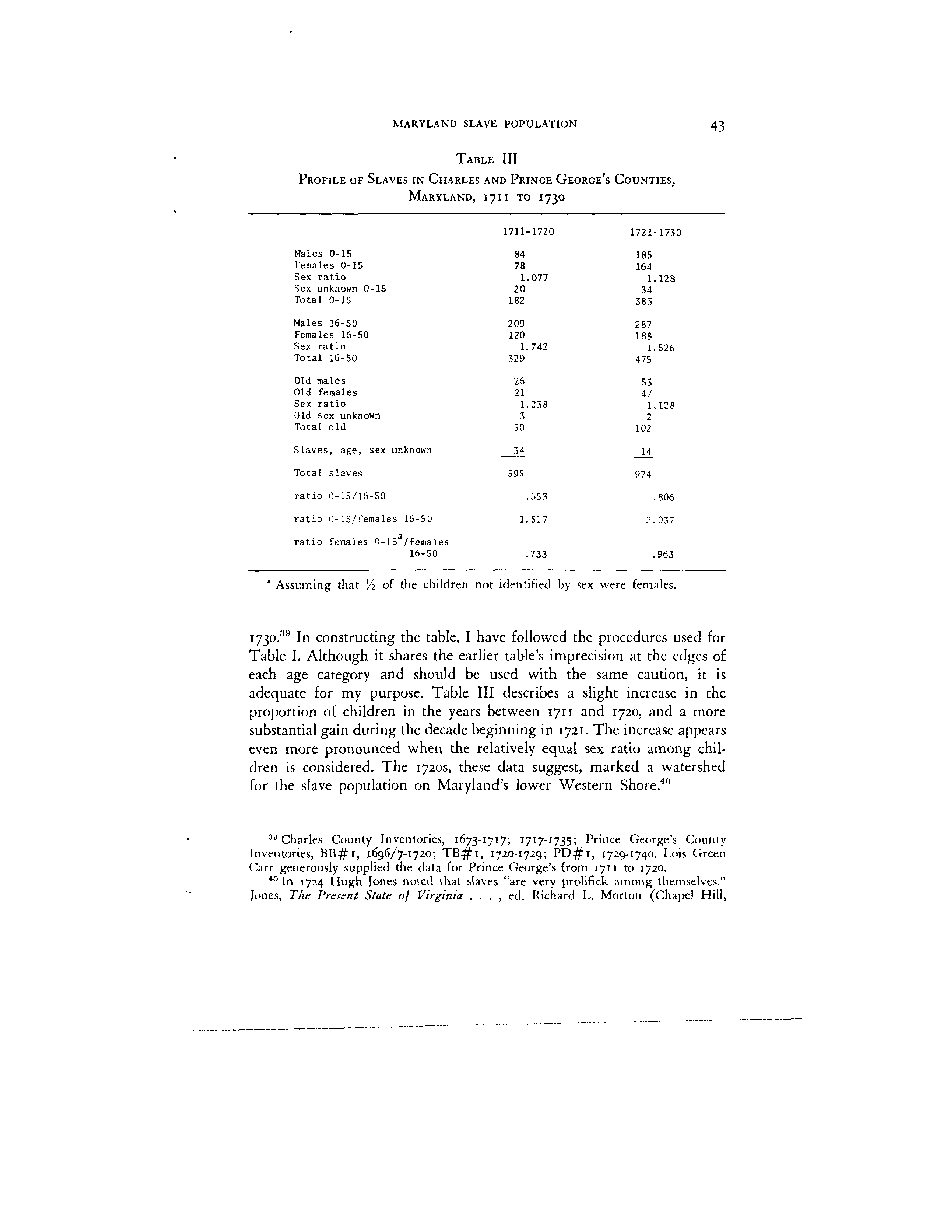
I730.39 In constructing the table, I have followed the procedures used for
Table I. Although it shares the earlier table's imprecision at the edges of
each age category and should be used with the same caution, it is
adequate for my purpose. Table III describes a slight increase in the
proportion of children in the years between 1711 and 1720, and a more
substantial gain during the decade beginning in 1721. The increase appears
even more pronounced when the relatively equal sex ratio among chil-
dren is considered. The 17205, these data suggest, marked a watershed
for the slave population on Maryland's lower Western Shore.40
30 Charles County Inventories, 1673-1717; 1717-1735; Prince George's County
Inventories, BB$i, 1696/7-1720; TB$i, 1720-1729; PD#i, 1729-1740. Lois Green
Carr generously supplied the data for Prince George's from 1711 to 1720.
40 In 1724 Hugh Jones noted that slaves "are very prolifick among themselves."
Jones, The Present State of Virginia . . . , ed. Richard L. Morton (Chapel Hill,
�
|

