|
101
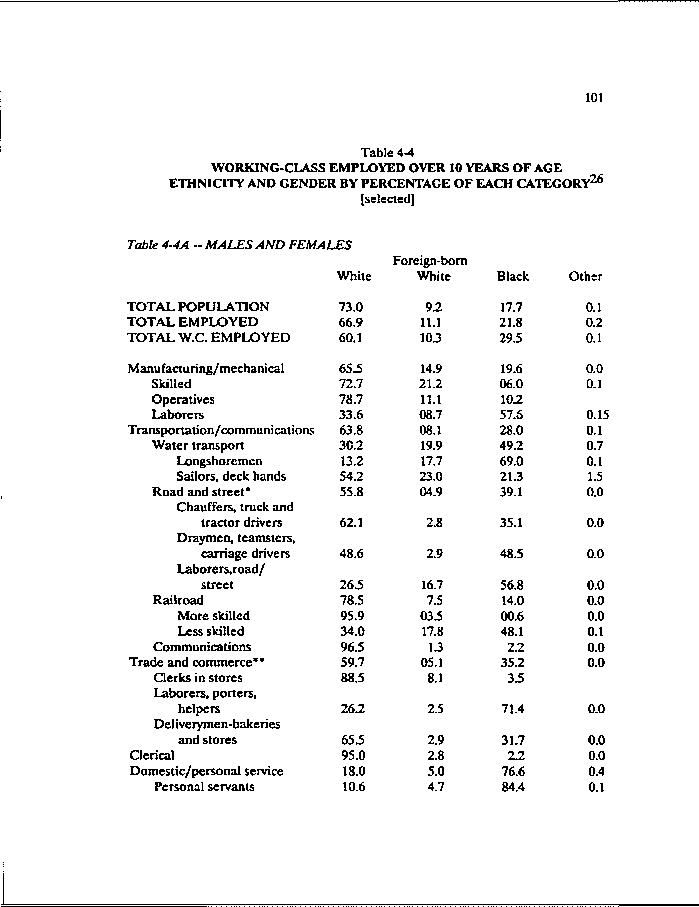
Table 4-4
WORKING-CLASS EMPLOYED OVER 10 YEARS OF AGE
ETHNICITY AND GENDER BY PERCENTAGE OF EACH CATEGORY26
[selected]
Table 4-4A - MALES AND FEMALES
Foreign-born
White White Black Other
TOTAL POPULATION 73.0 9.2 17.7 0.1
TOTAL EMPLOYED 66.9 11.1 21.8 0.2
TOTAL W.C. EMPLOYED 60.1 103 29.5 0.1
Manufacturing/mechanical 65.5 14.9 19.6 0.0
Skilled 72.7 21.2 06.0 0.1
Operatives 78.7 11.1 10.2
Laborers 33.6 08.7 57.6 0.15
Transportation/communications 63.8 08.1 28.0 0.1
Water transport 30.2 19.9 49.2 0.7
Longshoremen 13.2 17.7 69.0 0.1
Sailors, deck hands 54.2 23.0 213 1.5
Road and street* 55.8 04.9 39.1 0.0
Chauffers, truck and
tractor drivers 62.1 2.8 35.1 0.0
Draymen, teamsters,
carriage drivers 48.6 2.9 48.5 0.0
Laborers,road/
street 26.5 16.7 56.8 0.0
Railroad 78.5 7.5 14.0 0.0
More skilled 95.9 03.5 00.6 0.0
Less skilled 34.0 17.8 48.1 0.1
Communications 96.5 13 2.2 0.0
Trade and commerce** 59.7 05.1 35.2 0.0
Clerks in stores 88.5 8.1 3.5
Laborers, porters,
helpers 26.2 2.5 71.4 0.0
Deliverymen-bakeries
and stores 65.5 2.9 31.7 0.0
Clerical 95.0 2.8 2.2 0.0
Domestic/personal service 18.0 5.0 76.6 0.4
Personal servants 10.6 4.7 84.4 0.1
|

